
In honor of Black History month, Merchant Maverick’s latest data study focuses on the “Top States For Black Women-Owned Businesses In 2021.” The results of this study may be surprising to some. We found that, despite certain persistent cultural inequalities in the region, the South is a great place for Black women to own businesses in the US. The region’s large Black population, high engagement of Black women entrepreneurs, and small business-friendly economy is overall favorable to this demographic of business owner.
The southern states that capped our list often did so thanks to a larger than average Black population. All but three out of the top 10 states have Black populations exceeding 21% of each state’s overall population. It makes sense; a more robust Black population usually means a better support network for Black female entrepreneurs. However — as you’ll see later down in the report — a few states impressively achieved high marks despite this general trend.
Even regardless of the size of their Black population, states in our report’s top 10 frequently beat the trendline when looking at the percentage of businesses run by Black women: 1.41% of all businesses in the top 10 states are run by Black women, which nearly doubles the national average of 0.74%. These states also often engage Black women to become business owners at a faster rate than other states. Many additionally feature impressive economic landscapes for entrepreneurs of all races and genders.
Our methodology for this report is explained in more detail below, but here are the eight basic metrics we explored to come up with a ranking for all 50 states:
- Percent of employer firms led solely by Black women (17.5% of the overall score)
- Percent of employees at solely Black women-led firms (17.5% of the overall score)
- Percent of Black women self-employed in their own incorporated business (17.5% of the overall score)
- Average income of Black women self-employed in their own business (17.5% of the overall score)
- Workforce growth between 2018 and 2019 (10% of the overall score)
- Cost of living (10% of the overall score)
- State income tax rates (5% of the overall score)
- Unemployment rates (5% of the overall score)
We did not examine business funding opportunities in this report, looking instead at indicators of business ownership and engagement, but we would be remiss if we did not acknowledge that funding for the Black community, and women in general, is largely unavailable. The release of the Merchant Maverick Opportunity Grants program this month seeks to recognize inequality in funding opportunities by providing grants specifically to businesses owned by Black women.
We must also note that the impact of COVID-19 may not be fully represented in this report. The Black community has been particularly affected by the pandemic, with Black Americans 2.8 times more likely to die from COVID than white Americans. However, most of the latest entrepreneurship data in the US is from 2019 or earlier. As such, we can’t accurately gauge the pandemic’s role in the current state of Black women who own businesses.
The Top 10 States For Black Female Business Owners In 2021
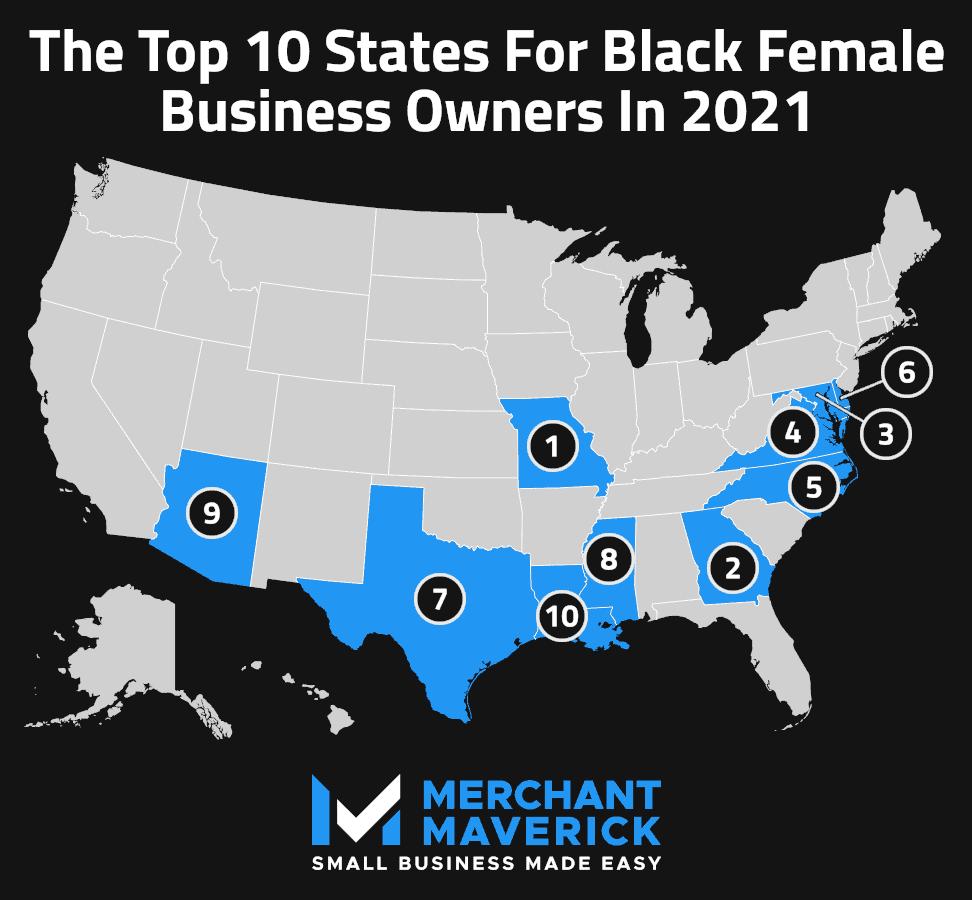
Generally speaking, our top 10 states are located in the American South, which boasts a large Black population. However, a few states notably buck the trend. Missouri — the number one state on the list — as well as Texas and Arizona, have all performed well despite smaller-than-average Black populations.
1. Missouri
Score: 64.9
By our research, Missouri is the clear-cut No. 1 state for Black women who own businesses. Most notably, 3.56% of all employer firms in the Show-Me State are run solely by Black women — a number far higher than any other state in the US. Missouri ranks sixth in the nation in terms of black female self-employment: 1.06% of all Black women in Missouri are employed in their own business. The state ranks ninth overall in another important metric, as 0.49% of all employees in the state are employed at Black women-led firms.
Most states follow a predictable trend: a higher Black population equals a higher rate of businesses owned by Black women. Missouri is different. Despite having a Black population that is less than 13% of the overall population (well below the national average of 14.2%), Missouri is far-and-away the leader among the percent of employer firms led solely by Black women.
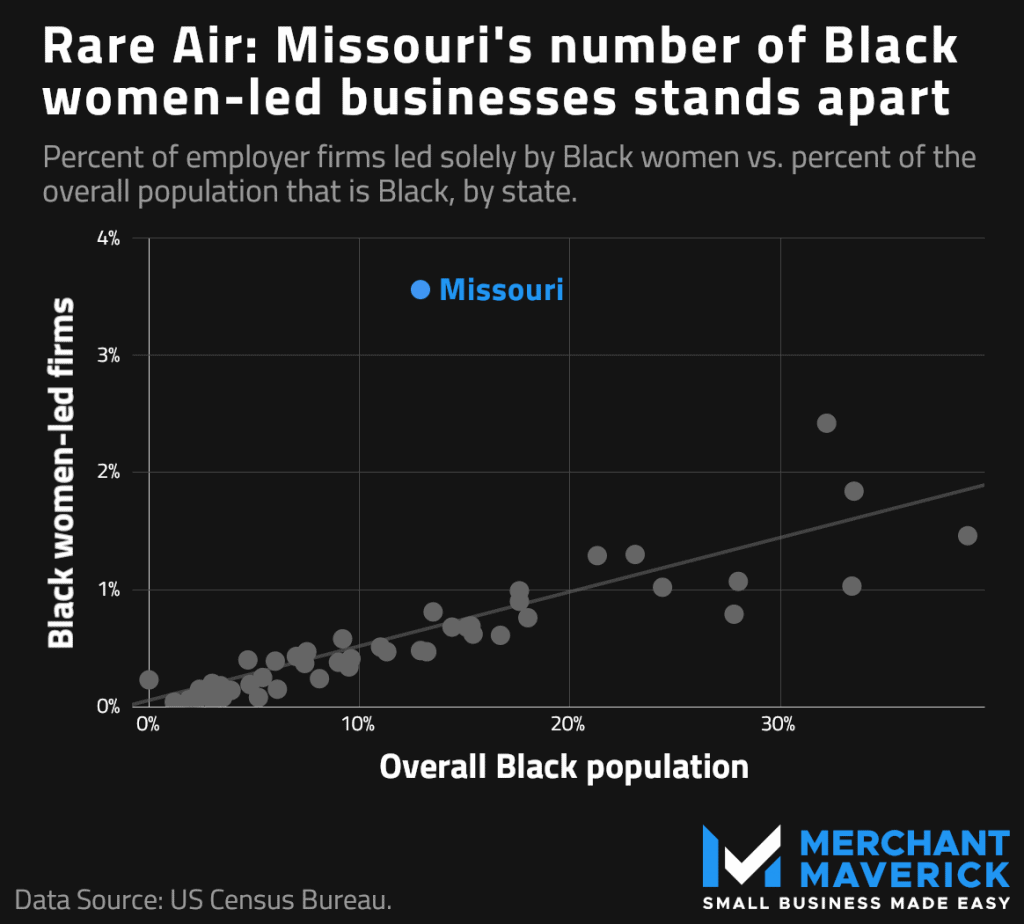
It’s not exactly clear why Missouri has such an outsized portion of employer firms led by Black women. However, our findings echo previous research. In 2018, the Federal Reserve Bank of Kansas City issued a report that found Missouri to have the fastest growth rate nationally for Black women-owned employer firms. Clearly, Missouri is doing something right to front the charge for a more diverse entrepreneurial landscape.
2. Georgia

Score: 62.8
Just like Missouri, Georgia shines across the gamut of metrics we surveyed. The Peach State ranks third in the percentage of employer firms led by Black women (1.84%) and fourth for the percentage of employees employed at Black women-led firms (0.74%).
Georgia also put up a good showing in engagement for Black women entrepreneurs: 0.95% of all Black women in the state are self-employed in their own businesses (which ranks eighth nationally). Additionally, the state’s workforce had an impressive 2.13% growth rate between 2018 and 2019, which is 11th overall.
Georgia’s high ranking isn’t all too surprising — the state has one of the largest Black populations in the country (33.5%). However, Georgia still showed impressive results, regardless of the size of its Black population.
3. Maryland
Score: 62.6
Maryland rounds out the top trio with a solid slate of metrics. The state is notably strong in the percent of employees employed at firms led solely by Black women (0.97%, which is good for first in the nation). The percent of employer firms led solely by Black women is excellent, too, as 2.42% of all employer firms in the state are headed by Black women, a number that trails only Missouri.
As with Georgia, Maryland has a sizable Black population (32.2%), so a high ranking is to be expected. Of course — just like Georgia — Maryland still out-performs the trendline in most metrics, allowing the state to rank solidly in the top three.
4. Virginia

Score: 58.3
Trailing a bit behind the top three states is Virginia. Unlike the top three states, which crack the top 10 in three out of the four demographic-specific metrics, Virginia is ranked in the top 10 for all four demographic-specific metrics. However, Virginia isn’t higher than third in any of those key metrics, which ultimately drops the state to fourth overall.
Virginia, which also wound up in the top five in Merchant Maverick’s best states for women-led startups report, does best in terms of the average income for self-employed Black women business owners (which, at $60,847, ranks third nationally), and in the percentage of employees employed at businesses led solely by Black women (at 0.67%, ranking fifth nationally). The Old Dominion is ranked sixth in percent of employer firms led solely by Black women (1.29%) and 10th in the nation in percent of Black women self-employed in their own businesses (0.84%).
5. North Carolina

Score: 56.8
North Carolina comes in at No. 5 overall thanks to the state’s percentage of employer firms that are led by Black women — at 1.30%, this number is good for fifth in the country. Nationally, the Tar Heel State ranks seventh overall in terms of both the percent of employees employed by firms led by Black women (0.58%) and the percent of Black women who are self-employed business owners (1.00%).
Like other top 10 states, North Carolina has a fairly healthy Black population (23.1% of the state’s overall population is Black). North Carolina also records solid results for our more general economic metrics, such as workforce growth — between 2018 and 2019, North Carolina’s workforce grew 2.18%, the ninth-fastest rate in the US.
6. Delaware

Score: 55.8
Delaware does really well in terms of Black, female engagement in entrepreneurship. 1.19% of all Black women in the Diamond State are self-employed in their own business, which ranks second nationally and is highest among other top 10 states.
Beyond that metric, Delaware also has high rankings when it comes to the percentage of employees employed at Black women-led firms (at 0.63%, this ranks sixth nationally) and the percent of employer firms led by Black women (1.02% is good for ninth in the nation). With 24.4% of the state’s population being Black, it’s no surprise to see Delaware ranked highly.
7. Texas

Score: 54.4
Coming in at just 13.5%, Texas has a lower Black population than most other states in the top 10. However, the state still performs well in demographic-specific metrics. 1.07% of all Black women in Texas are self-employed in their own business, and those women post an average income of $41,321 per year. Those numbers clock in at fifth and 10th, respectively.
Texas also sees 0.81% of all its employer firms led by Black women (12th nationally) and 0.41% of employees in the state work at firms led by Black women (11th nationally).
Beyond the impressive demographic-specific numbers, Texas also saw its workforce grow 2.38% from 2018 to 2019 (seventh nationally), and the state has no income tax.
8. Mississippi
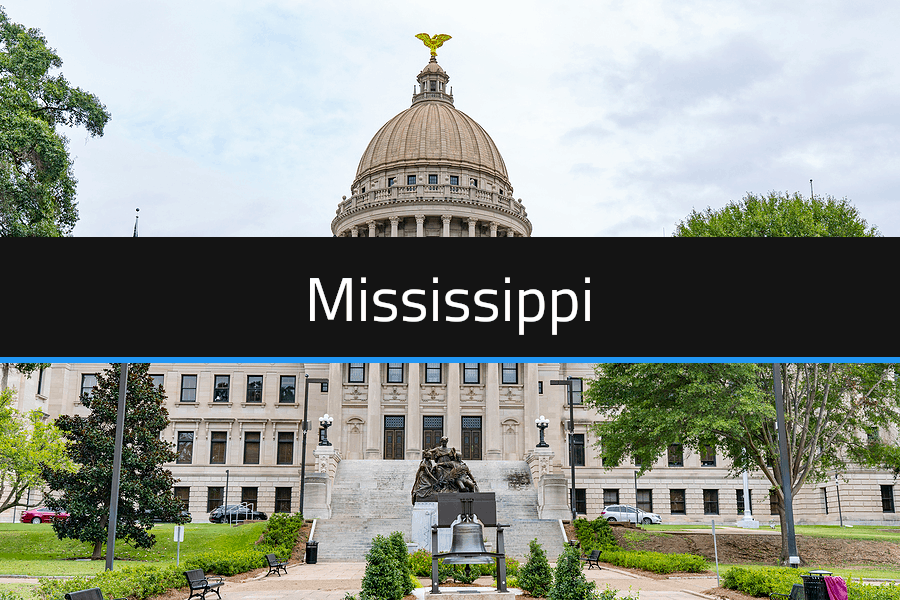
Score: 53.1
Thanks to a couple of top five metrics, Mississippi is solidly in the top 10 overall. An impressive 0.76% of employees in the state are employed at firms led solely by Black women — third in the nation — while 1.46% of employer firms are led solely by Black women.
It’s also noteworthy that Mississippi is the cheapest state to live in according to the Bureau of Economic Analysis’ Regional Price Parities, which we used to measure the general cost of living in each state. All told, Mississippi’s inclusion in the top 10 isn’t too much of a surprise — the state has the highest percent of Black people in the union at 38.9%.
9. Arizona

Score: 49.6
Arizona performs well here, despite having a relatively low Black population of 6%. It’s also noteworthy that Arizona is the only state in the top 10 not to be in or neighboring what we traditionally view as the South.
The Grand Canyon State achieves its top 10 ranking because Black women choose entrepreneurship there at a better-than-average clip — Census Bureau data reveals that 1.12% of all Black women in the state are self-employed in their own businesses, which ranks third overall. On top of that, those self-employed women rake in an average income of $40,309 per year, a number that ranks 11th nationally.
Beyond demographic-specific data, this southwestern state posts other solid numbers that make entrepreneurship generally viable. Arizona’s workforce grew 3% between 2018 and 2019, making it first in the US by this metric. The state’s 4.5% income tax rate may also be tantalizing to those with an entrepreneurial spirit.
10. Louisiana

Score: 48.7
Louisiana sneaks into the top 10 thanks to two metrics: The Bayou State is ranked second nationally because 0.79% of the state’s employees are employed at Black women-led businesses. It is ranked eighth nationally for having 1.03% of its employer firms led by Black women.
Louisiana’s ranking is certainly affected by a larger than average Black population (at 33.4%, this number only trails Mississippi and Georgia). However, the state is also the eighth-best for cost of living in the US, helping boost its overall score.
Complete Ranking Of All 50 States
We’ve included a look at the complete data set for this report below, including each state’s score and rank within each metric. You can also view the raw data we used for the report.
— View the raw data for all 50 states —
Methodology
For this report, we gathered data across eight different metrics for all 50 US states. The data for each metric was normalized from 0-100 so that the highest-ranked state within a given metric had a score of 100 and the lowest-ranked state had a score of 0. These normalized scores were then multiplied by specific weights to achieve an overall score for each state.
We pulled our data from five separate sources:
To best determine the best states for Black women business owners, we chose these metrics:
- Percent of employer firms led solely by Black women (17.5% of the overall score): This metric compares the number of employer firms led by Black women to the total number of employer firms in the state, per data from the Census Bureau’s 2018 Annual Business Survey. It provides a very basic look at the level of gender and racial diversity in each state.
- Percent of employees at solely Black women-led firms (17.5% of the overall score): This metric compares the number of employees at Black women-led employers firms to the total number of employees in the state, per data from the Census Bureau’s 2018 Annual Business Survey. It provides another sample to estimate gender and racial diversity as well as the economic strength of Black women-led firms on a state-by-state basis.
- Percent of Black women self-employed in their own business (17.5% of the overall score): This metric compares the number of Black women self-employed in their own business to the total number of Black women in the state, per the US Census Bureau’s 2019 American Community Survey. It gauges how actively Black women engage in entrepreneurial roles within each state.
- Average income of Black women self-employed in their own incorporated business (17.5% of the overall score): This is simply the average yearly income for self-employed Black women business owners, per the US Census Bureau’s 2019 American Community Survey. It provides a glimpse at the earning potential a Black woman entrepreneur might have from state-to-state.
- Workforce growth between 2018 and 2019 (10% of the overall score): For this metric, we took the overall size of a state’s workforce in 2018 and compared it against the overall size of the workforce in 2019, per data from the Bureau of Economic Analysis. This metric gives a quick look at each state’s recent economic growth.
- Cost of living (10% of the overall score): The Bureau of Economic Analysis’ Regional Price Parities index was used to help estimate the cost of living in each state.
- State income tax rates (5% of the overall score): Each state’s highest income tax bracket for 2020 was tallied, with lower tax rates being considered better. States with lower income tax rates can provide entrepreneurs greater earning potential.
- Unemployment rates (5% of the overall score): These rates were pulled from the Bureau of Labor Statistic’s November 2020 update. For the purposes of this report, unemployment rates are used as a snapshot to gauge the economic health of each state.
Note that because Black female entrepreneurs make up a small sample size for certain states in the Census Bureau surveys, we adjusted some outlying results for accuracy.
Key Takeaways
We still have a long ways to go to make the entrepreneur landscape more inclusive and diverse. Despite equaling roughly 7% of the US population, our data research found that Black women only solely run 0.74% of all employer firms in the country. Such a drastic under-representation must improve.
However, several pockets of the country are paving the way for a racially and gender diverse economy, and that provides some reason for optimism. The South, in particular, offers fertile ground for Black female entrepreneurs. The region is notably led by stalwart states such as Georgia and Virginia that outpace much of the country in terms of fostering successful Black businesswomen. And nearby Missouri shows great potential because its makeup of Black women business owners more accurately represents the state’s Black population.
The data shows that there is definitely a spark for Black women entrepreneurs in the US. Hopefully, that spark will develop into a flame as we build the country back up post-COVID — a diverse and inclusive array of economic leaders will undoubtedly better reflect the diversity woven deep into the American fabric. Our hope is also that traditional funding avenues will become more inclusive and more widely available to underrepresented demographics, making it easier for small businesses led by Black women to ultimately succeed. Applications for Merchant Maverick Opportunity Grants for Black Female Entrepreneurs open February 1st, 2021. For more information on other grant programs and other financial assistance available to minority women who own businesses, please see the following resources: